Custom segments allow filtering web metrics for a specific set of users. These segments give more visibility to priority groups and their actions on the website – ultimately supporting the strategic evolution of your content.
Google Analytics Segments and Audiences
Segments and audiences help you identify groups of visitors to your site.
Segments Versus Audiences
Segments and Audiences are related, but not quite the same.
Segments
- Allow you to identify a subset of visitors based on a certain criteria.
- Can't be applied as a secondary dimension in an Analytics report.
- Are created by individual users.
- Do not have a limit in terms of how many you can create.
- Can be used to tailor a Google Analytics view. Up to four can be utilized at a time.
- Audiences can be created from Segments.
Audiences
- Allow you to identify a subset of visitors based on a certain criteria.
- Can't be applied as a secondary dimension in an Analytics report.
- Live in a Property and are created by an Admin.
- Can be used to tailor a Google Analytics view. Up to four can be utilized at a time.
- Can be compared against each other in Analytics, but there is a limit of 50 per account.
- Allow you to reach those users in other ways through Google 360 products like Google Ads* or Google Optimize.
*In Google Ads, you build remarketing lists from the data collected by the remarketing tag. In Analytics, you build remarketing audiences from any of the data you have in Analytics. You can combine the two in a Google Ads account linked to an Analytics account.
How to Create Segments
You can create a segment from any of the standard reports outside of Real Time. Just above the time series chart on any report page, you will see a button called "Add Segment."
Criteria can be defined in an infinite amount of ways – from select geographies to requiring the completion of a sequence of behaviors on your pages. Be extremely deliberate in the custom segments that you design and ensure they are aligned with your priority audiences and target objectives. Additionally, consider employing a naming structure to help you organize your list; it will appear alphabetically by default. Here are a few additional things to think about when using segments.
- Custom segments are specific to individuals using the platform. You can share custom segments with other users, but custom segments created by you in a given view will not automatically be accessible to others.
- Each time you create a custom segment, Google will estimate the volume of users who meet your criteria. If your volume is too low, the custom segment will not be useful to you.
- The majority of standard reports are available for custom segments but not all.
- Individuals working in web analytics have a handful of custom segments and custom reports available on the web. Use the galleries liberally – even if you don’t import anything specifically, you can use their construction to help you create what you need to utilize.
Segment Ideas
You can choose to create your segment from existing criteria options or import from the Google Analytics Solutions Gallery. The gallery is a good resource to spur thinking about custom segments and find good sequencing criteria examples. Here are some ideas to get you started:
User Entry Point
Where a user is coming from (or isn’t!) can be incredibly helpful in understanding a host of things – from the impact of geography on goals to the site’s technology performance.
1 Users who access the website from outside of Ohio
We know that brand awareness is lower outside of Ohio, but do these users do more exploration? Are they less likely to complete goals? How are their inbound traffic sources different from Ohio-based visitors and how does that impact your strategy?
2 International visitors
Are these visitors finding the content we wrote specifically for them? Are they converting on site goals?
3 Target geographies based on potential advertising impact
If you have an offline media buy, creating a segment of the geographic markets you’re advertising in can help you understand if visitors from those areas (assume exposure to media) are behaving differently from those in markets without that exposure. In this case, it’s extremely helpful to have an expectation of what those different behaviors are; otherwise, you are going to be exploring for a very long time!
Identifying Who a User Is
You can utilize web content, conversion goals or inbound campaign names to make a good assumption about who a user is. Think carefully and critically about what pages or events completed might indicate that a user is a member of a priority audience.
1 Page content
Sections of your site are likely designed for specific audiences. You can utilize these pages to create segments but be careful – using just one visit to one of these pages probably isn’t a strong enough indicator. You may want to include 5 or more like pages as a criteria.
2 Campaign traffic
Individuals arriving on the site from one of your campaign tags are the audience you intended to reach. A great example of this is our current students who receive the onCampus Weekly emails. All of those emails use common tags and are only sent to current students. Therefore, you can use that campaign name as your criteria.
3 Form completions
Individuals completing an inquiry form on your website are likely prospective students. Therefore, anyone who accomplishes the inquiry interest or application interest conversion goal is likely a prospective student. You can take it a step further if you have different forms for undergraduate and graduate by combining the goal page location.
4 Device category
Segment based on device category to understand the behaviors of mobile, desktop and tablet users. This is a great way to take a look at site performance and goal completion rates to find opportunities to optimize the user experience.
5 Goal conversions
Are these audiences completing the intended conversion goals at a higher rate than the general population of web visitors?
A Segment Use Case
Let’s say you are asked to run a one-month campaign targeting prospective undergraduate students in central Ohio to drive campus visits. On the landing page you’re driving users to, there is a campus visit form, contact links for admissions counselors and a campus visit checklist PDF that they can download. Given the objective of the campaign, your primary success metric will be campus visit form submissions, though you may choose to also report on the secondary actions we just outlined.
NOTE: To make this use case possible, you must utilize UTM tagging parameters on marketing assets driving users to the web.
Before your campaign launches, we recommend creating segments in Google Analytics to track the 90-day behavior of campaign users. Listed below are a few sample segments you may choose to create:
- Segment 1: Campaign users who have successfully filled out the campus visit form
- Segment 2: Campaign users who have clicked on a link to contact an admissions counselor
- Segment 3: Campaign users who have downloaded the campus visit checklist
Once these segments are created, you’ll be able to conduct an overlap analysis. This analysis can be found in the advanced analysis section in Google Analytics 360.
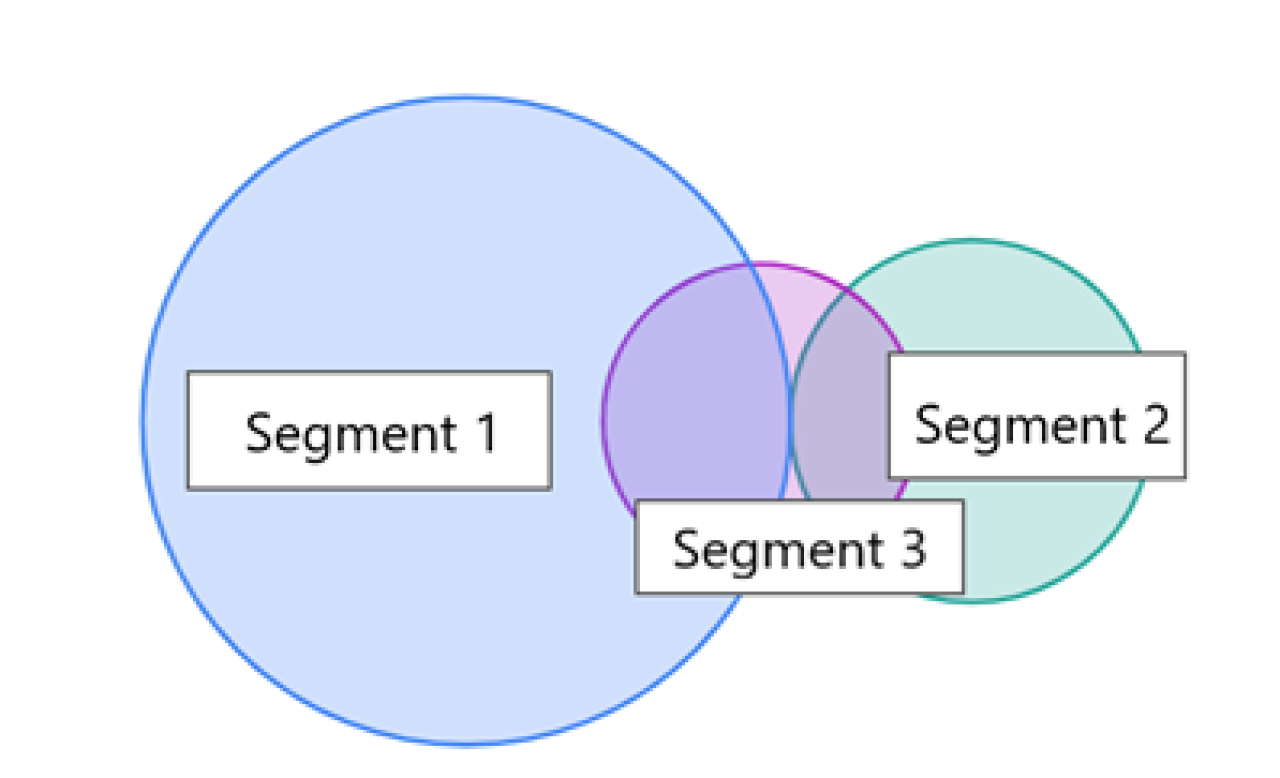
If you take the screenshot and apply it to the three sample segments you’ve created for the prospective student campaign, you may arrive at the following conclusions:
- Most campaign users are not engaging with all three site actions
- Filling out a campus visit form is the most common action for campaign users
- Those who fill out a campus visit form are not using the landing page to reach out to admissions counselors
- While those who’ve downloaded the checklist make up the smallest subset of users, those users are taking an extra action – whether that is completing a visit form or contacting an admission counselor
Once your one-month campaign has wrapped, you might want to look at these segments again to see whether your users are completing other relevant site actions along the prospective student journey – reading and sharing current student stories, requesting more information about specific academic programs and clicking from osu.edu to an academic application website. These are great bits of insights to include in your campaign wrap report.
Additional Resources
"Evaluating A Campaign" user guide
To view another example of how to use a segment, check out our user guide where we create segments to determine if someone visiting from our campaign was more likely to make an online gift than our regular website visitors.
Audience Experience Analytics
Learn more about common marketing audiences, objectives and more on digital milestones and key web properties.
Web Analytics Dashboards
Evaluate your campaign performance with web analytics dashboards