Ohio state students using computer

Web Analytics Dashboards

Analyze web traffic on your site using enterprise dashboards. We use Google Analytics events data transformed into custom reports to deliver essential information.

Get Access to Web Dashboards in Tableau

  1. Complete the Institutional Data Policy (IDP) training available from BuckeyeLearn.
  2. Request access to Marketing Analyst role in table through Service Now.
  • Request Type: New Account/Service
  • Tableau Project Name (click on search icon): University Marketing
  • Role: TAB-UNIV-MKT-Analyst

Available Dashboards

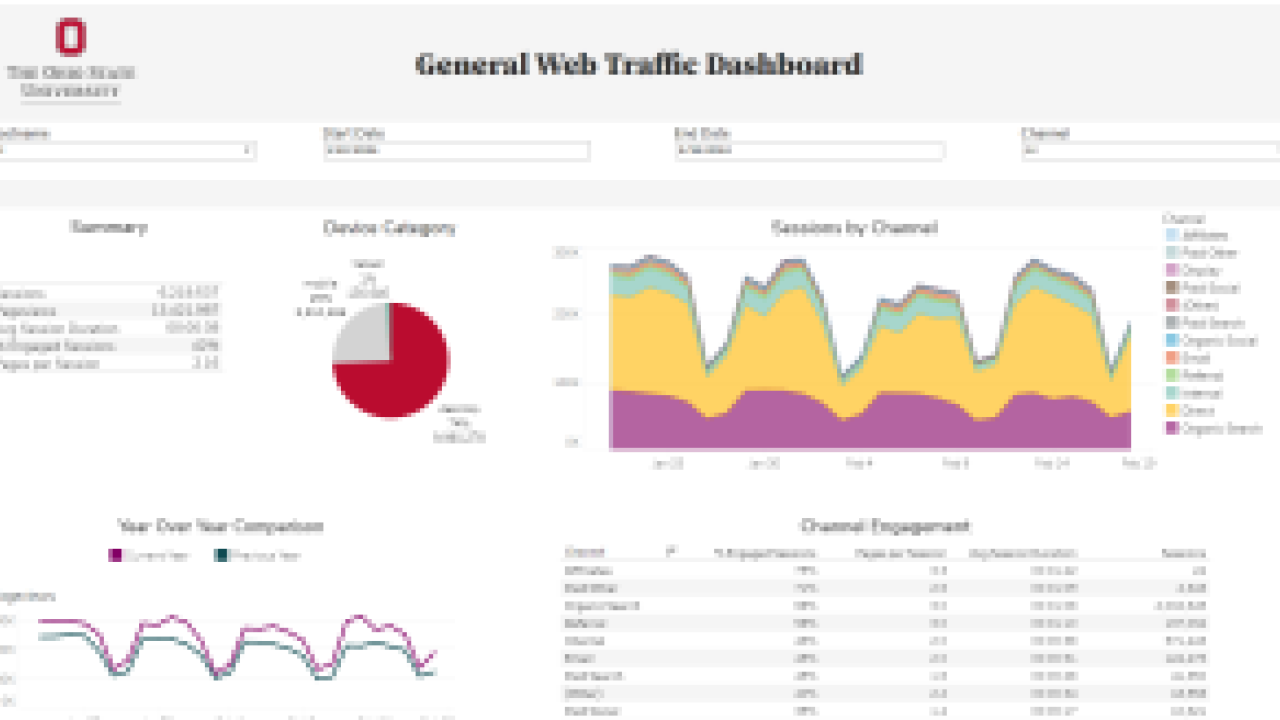
Web traffic dashboard showing a table, a pie chart, a stacked area chart, a line chart

Web Traffic Dashboard

Overview of sessions and pageviews on a subdomain (hostname) by date range, channel, device, and engagement. Shows a year over year comparison and top URLs and campaigns.
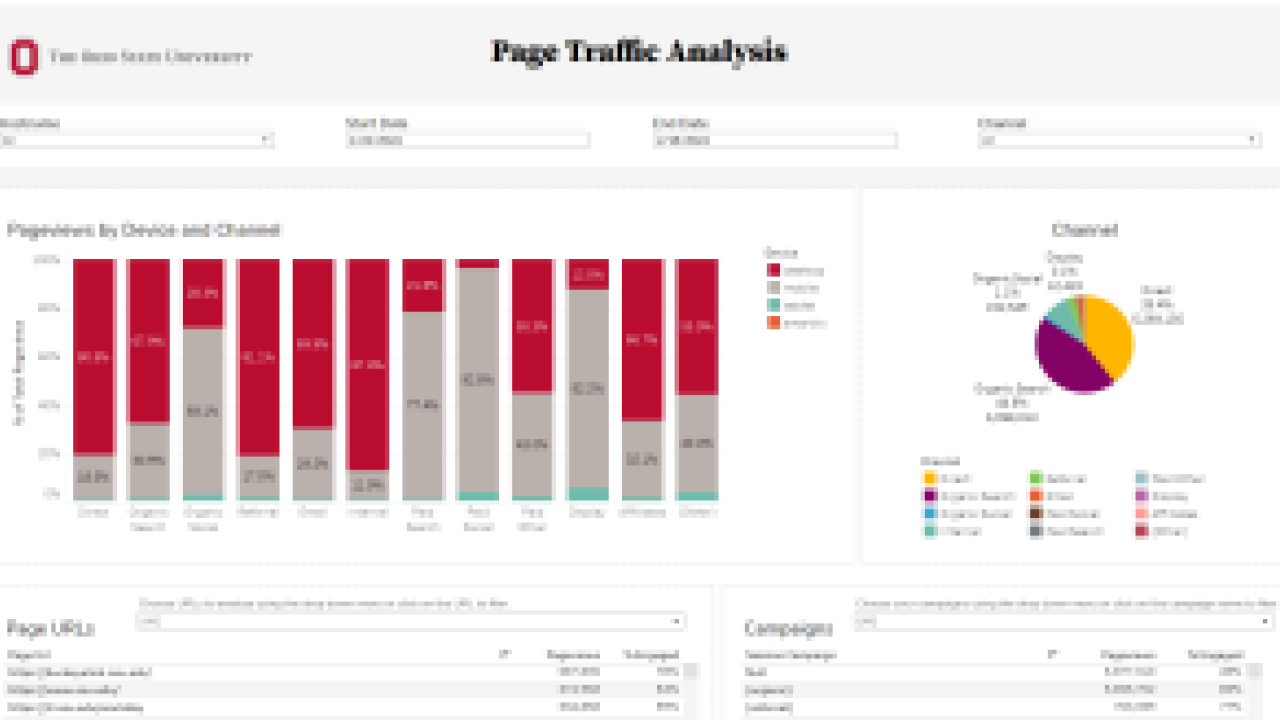
Dashboard for page URL analysis showing a stacked bar chart, a pie chart, and a table

Page URL Traffic Dashboard

Take a closer look at the top pages and campaigns on your subdomain. Select one or multiple page URL or one or multiple campaign names, and see the traffic breakdown by device, channel, and day.
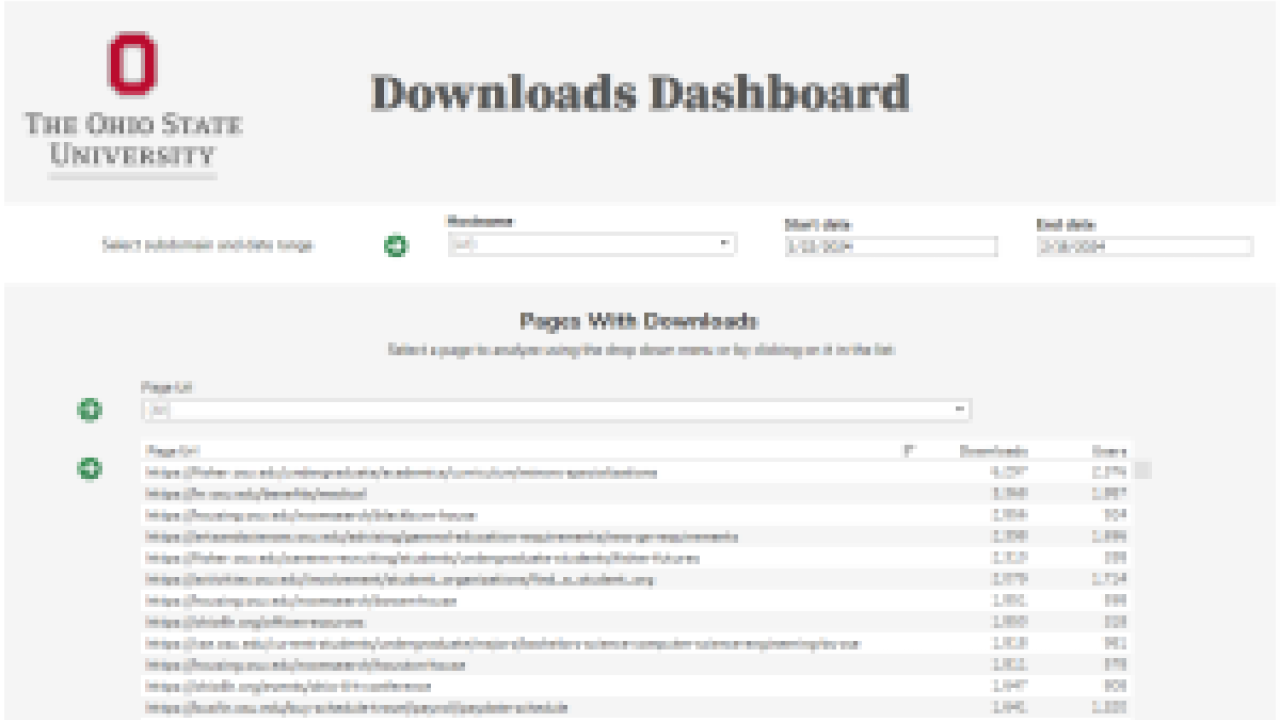
Dashboard showing filters and a table

Downloads Dashboard

Explore downloads by page URL and download URL for your hostname and dates. Understand the channels where downloaders are coming from and their devices.
Now at Ohio State dashboard preview with a table and a stacked bar chart

Now at Ohio State

Analyze traffic to Now at Ohio State podcast site by episode, channel, and device. Understand pageviews, number of plays on the website, and outbound clicks. This dashboard does not include plays on outside platforms.

Get Help

Contact adv-marketinganalytics@osu.edu to get help with data questions or request a new dashboard.