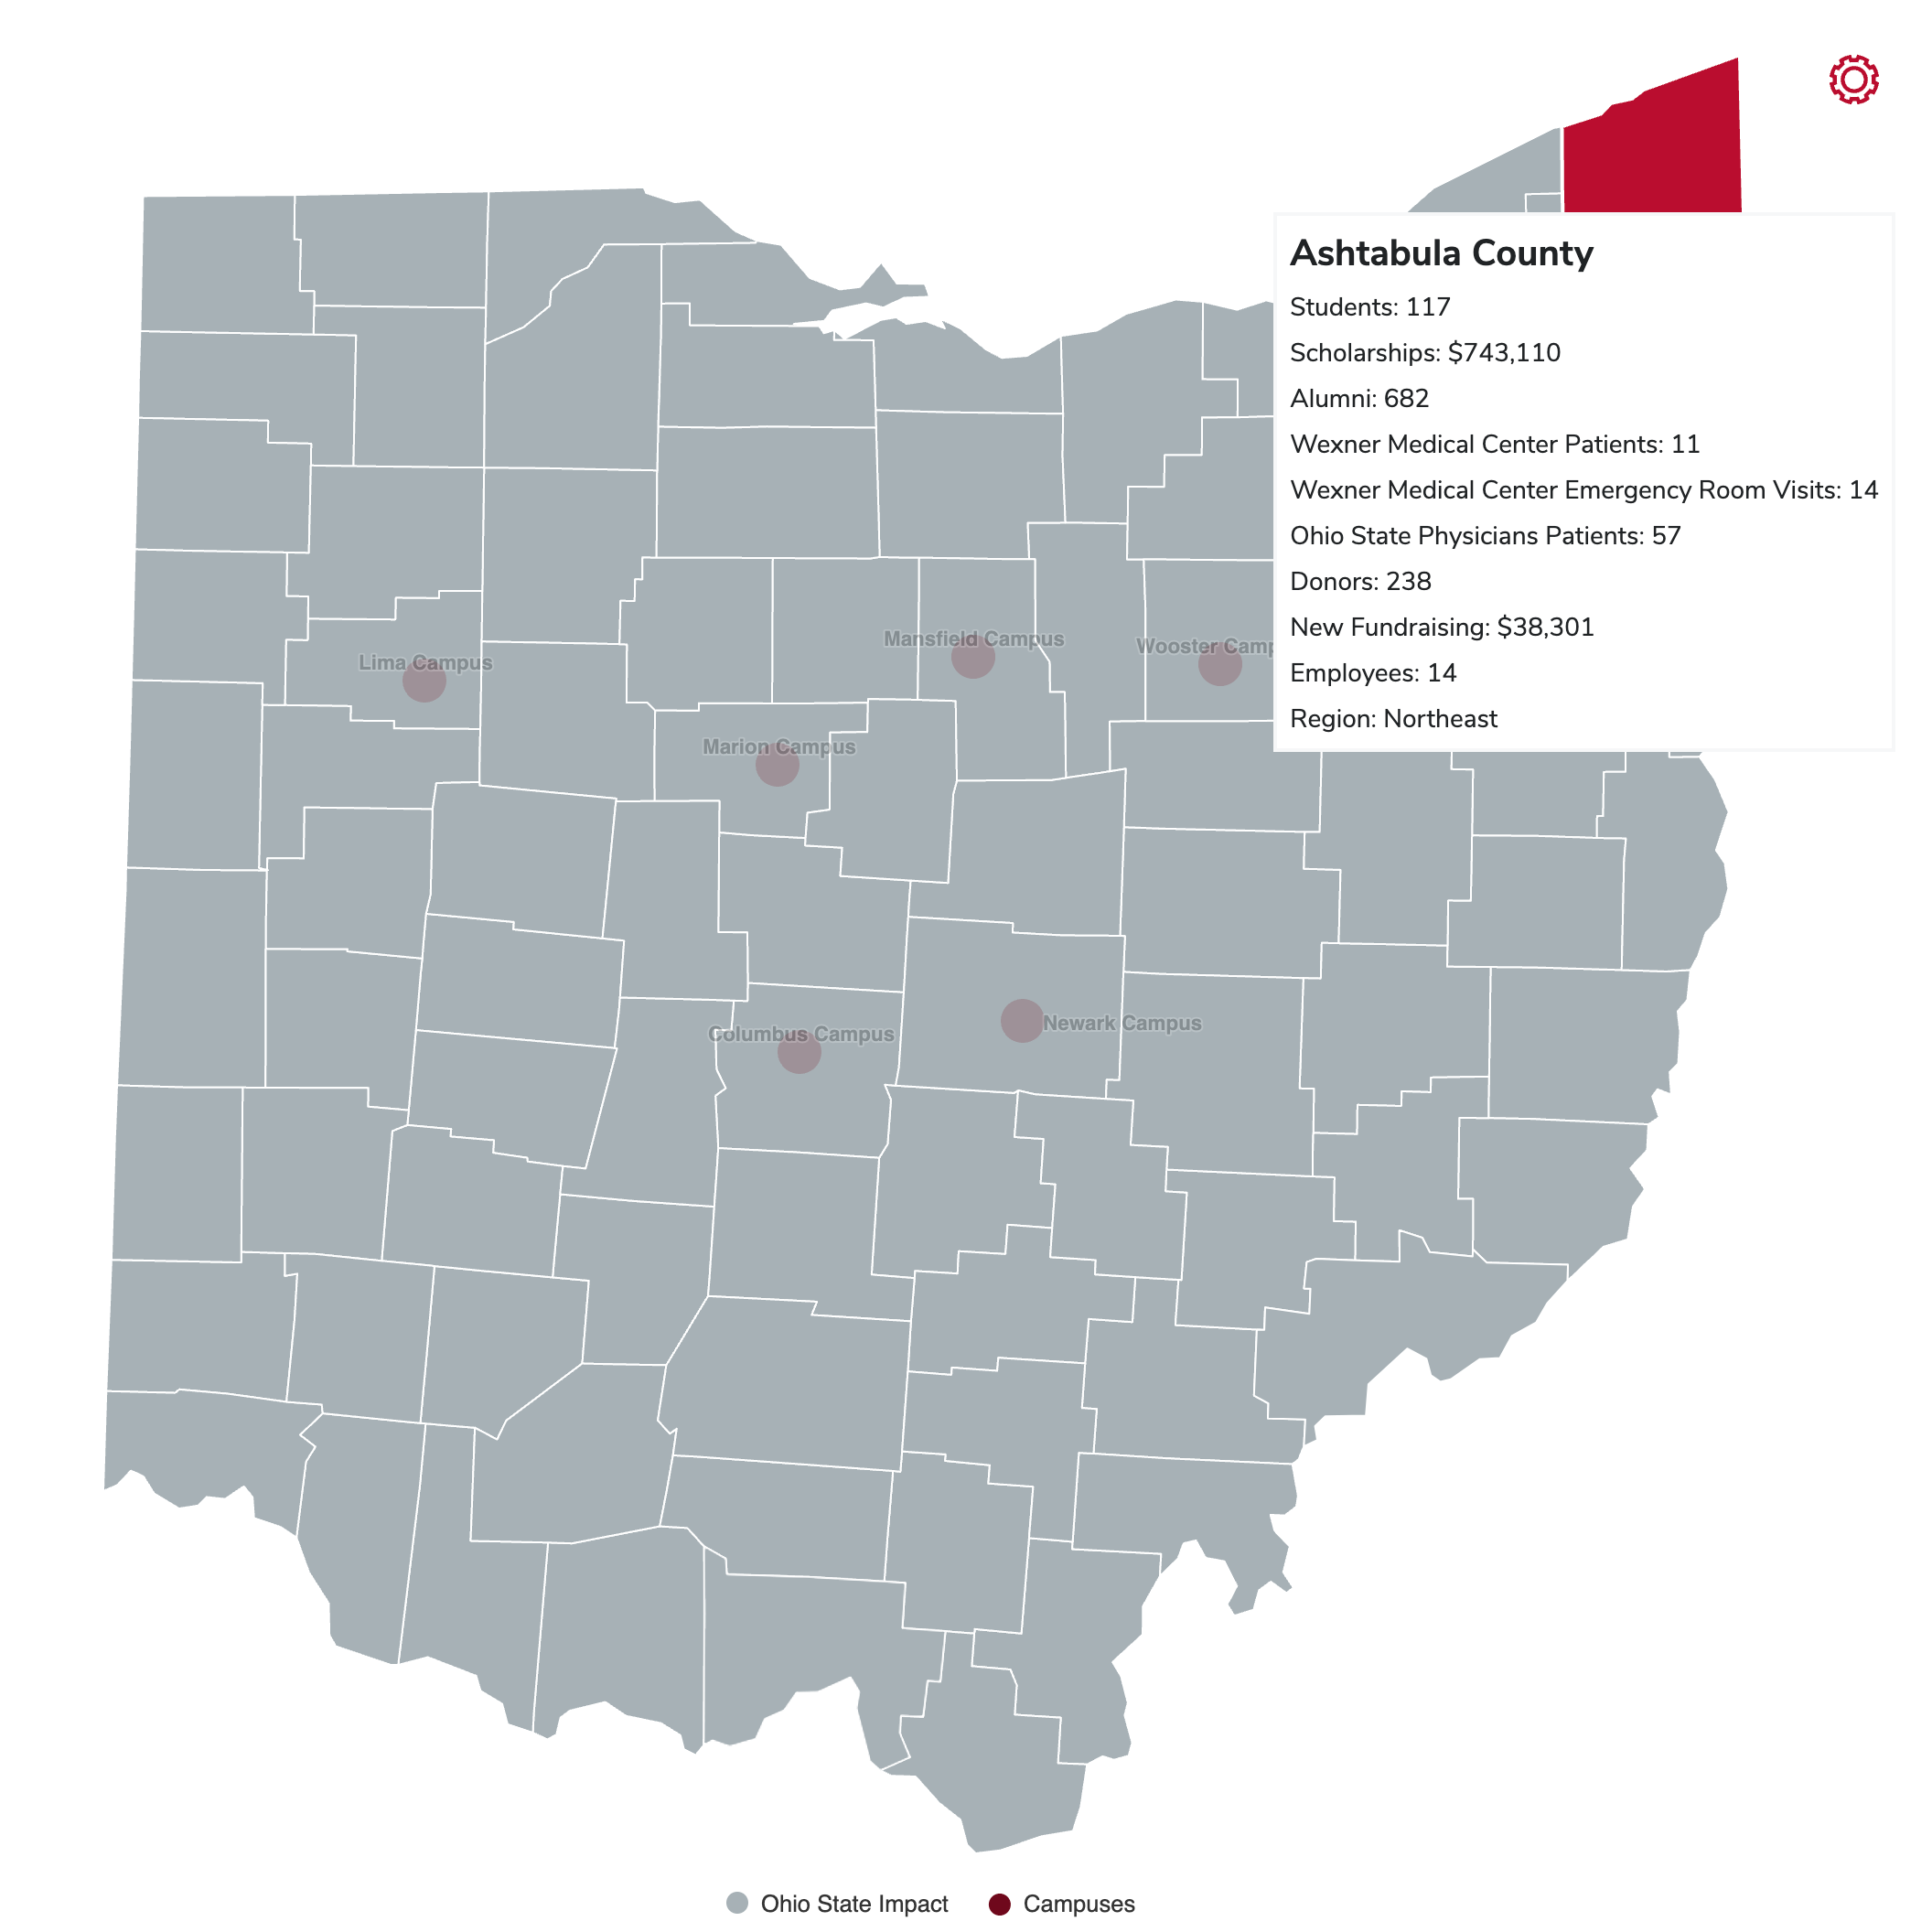
The report is housed on a website with an interactive map that allows users to view key data points county-by-county. This visualization showcasing Ohio State’s presence includes students, employees, buildings, donors and patients in each of the state’s 88 counties. View the PDF impact report here.
The report featured major research projects and investments, academic successes, efforts to improve access and affordability, health services provided throughout the state, and community-based impact from throughout 2023. In addition to the downloadable report, more than 100 printed reports were distributed to Advancement, ERIK, Office of Government Affairs and senior leaders to share with their stakeholders. The report has been downloaded 69 times. That is an average of 23 times a month since its initial publication.
Combined, these are powerful advocacy and communications tools that combine data and storytelling in an easily sharable, on-demand format. Planning for FY26 includes an expansion of the map data and creation of additional storytelling opportunities.

